Clouds of uncertainty continued to hang over U.S. equity markets last week. The S&P 500 slid 1.5% as investors sought refuge in safe-haven assets. Treasury yields declined significantly across the curve, including 0.15–0.20% drops in 2- and 10-year notes, while gold rallied 6.6% and touched record highs intraweek. Big tech and cyclical sectors underperformed. Tariff uncertainty captured most of the blame for the risk-off rotation, but earnings have now “entered the chat.” Several companies pulled forward guidance due to a lack of clarity on trade and/or flagged developing downside risk to growth. Tech giant NVIDIA (NVDA) made headlines after warning of a $5.5 billion revenue hit after the White House restricted the company from exporting its H20 chip to China. The vast unknowns on trade policy have further muddied the outlook on inflation, interest rates, and monetary policy. Based on this backdrop, LPL Research maintains its tactical neutral (not negative) stance on equities and is introducing a revised S&P 500 price target. More on that below.
Revising Our S&P 500 Price Target
With little visibility into where tariff rates shake out and the effects on earnings, it’s hard to have much conviction in a year-end S&P 500 target. Given the high degree of uncertainty, we use scenarios and a wider range to get more comfortable with our target and to increase our odds of accuracy (though we recognize these targets are more art than science).
Recall our year-end 2025 fair value target for the S&P 500, released last December, was 6,275–6,375. That range was rightly well below consensus at the start of the year, but is now too high based on the new tariff regime. What we do know is that tariffs are clearly a drag on earnings this year and the outlook for corporate America. There is a growing list of major U.S. companies that have already pulled forward guidance, including Delta Air Lines (DAL) and Walmart (WMT), while others continue to cite trade uncertainty as a major downside risk to earnings. According to the Chief Executive Group, nearly 75% of 329 U.S. CEO’s surveyed said tariffs would hurt their business in 2025.
While we know tariffs could have a material impact on earnings, we don’t know where they will land. However, one thing is clear: we’re not going back to the sub-3% tariff rates that were in place for many decades anytime soon. An additional 10% incremental tariff is roughly a 3% hit to S&P 500 earnings per share. This implies that expectations need to come down, even under a best-case scenario where the added reciprocal tariffs are eliminated.
The top-down S&P 500 consensus earnings estimate is currently at $266, as highlighted in the “Consensus Earnings Estimates Have Barely Fallen Since Tariffs Announcements” chart. This represents only a $3 reduction from estimates established at the start of the year. Earnings estimates for 2026 tell a similar story and appear subject to downward revisions, a theme we believe will unfold as more companies report earnings this quarter and/or if trade negotiations progress into trade deals.
Consensus Earnings Estimates Have Barely Fallen Since Tariff Announcements
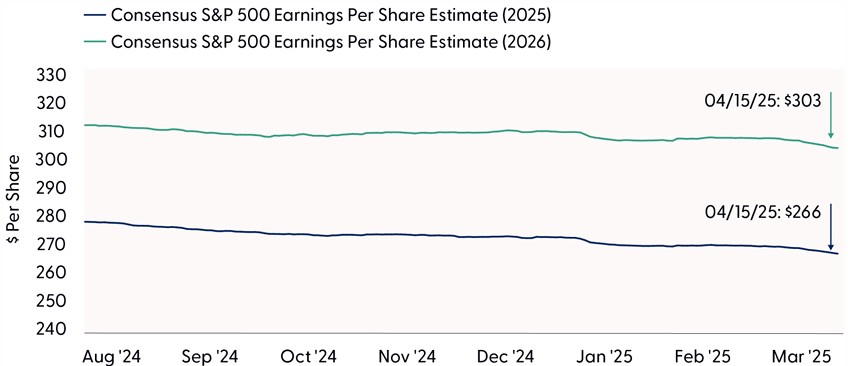
Source: LPL Research, FactSet 04/15/25
Disclosures: Indexes are unmanaged and cannot be invested in directly. Estimates may not materialize as predicted.
In terms of scenarios from our perspective, we would think about earnings in the $250–$255 range for this year and potentially $265–$285 for 2026, depending on where tariff rates shake out. Don’t forget about the upside potential from corporate America’s continued strong investment in artificial intelligence (AI) capabilities and the resulting productivity gains that can be achieved. That said, it’s tough to justify a price-to-earnings (P/E) multiple above 20 in an environment with the Federal Reserve (Fed) on hold, inflation pressures rising (even if only temporarily), and interest rates above recent trends. Much to President Trump’s dismay, Fed Chair Jerome Powell made it clear last week that policymakers are in no rush to start cutting rates, stating, “We are well positioned to wait for greater clarity before considering any adjustments to our policy stance.” Powell also hinted at stagflation risk under a potential “challenging scenario” where the Fed’s dual mandates of price stability and maximum employment are in tension.
So, if we construct bull, bear, and base cases and apply probabilities to each scenario, we can justify a P/E of about 21. Next, if we give our already conservative S&P 500 earnings estimate in 2026 a slight $5 haircut and get to $270, we end up in the vicinity of 5,700 for a year-end target. That assumes tariff rates come down relatively quickly to near 10% and the Fed cuts rates at least once, helping bring the 10-year Treasury yield down toward the middle of our year-end target range of 3.75–4.25%.
The forecasts applied to this methodology result in our revised year-end 2025 fair value S&P 500 target range of 5,650–5,800, representing 7–10% of potential upside based on the S&P 500’s April 17 closing price.
Turning to the Charts
Using technical analysis can help cut through all the noise and headlines in the market. The message from price action can be much more transparent than what you may read about in the financial press or see on television, especially during times when fear is running rampant and there is minimal fundamental clarity. Price has no agenda, political affiliation, subscriptions to sell, or clickbait motives, and at the end of the day, it is what matters most to investors.
So, what is price action telling us? First, and perhaps most importantly, the longer-term uptrend for the S&P 500 remains intact. This suggests the path of least resistance from here is likely higher, but not without near-term risks. Second, a capitulation point was likely reached amid historic volatility during the week of April 7. Several items on our checklist for a durable low were checked, including (but not limited to) historically oversold conditions at the index and constituent level, washed-out readings across market breadth measures, peak fear likely being reached, and record-level trading volume. Third, evidence of a capitulation does not mean stocks will rally back to record highs or that a retest of the recent lows is off the table. While we remain open-minded to the prospect of a more V shaped recovery, underwhelming participation and the lack of cyclical leadership off the recent lows suggest there is still an elevated risk for a retest of the 4,835 low. This support zone, highlighted in the “S&P 500 Is Holding Above Key Support” chart, expanded to 4,800 to include the 2022 highs and a key retracement level from the bull market run since 2022, is essential for the S&P 500 to maintain.
S&P 500 Is Holding Above Key Support
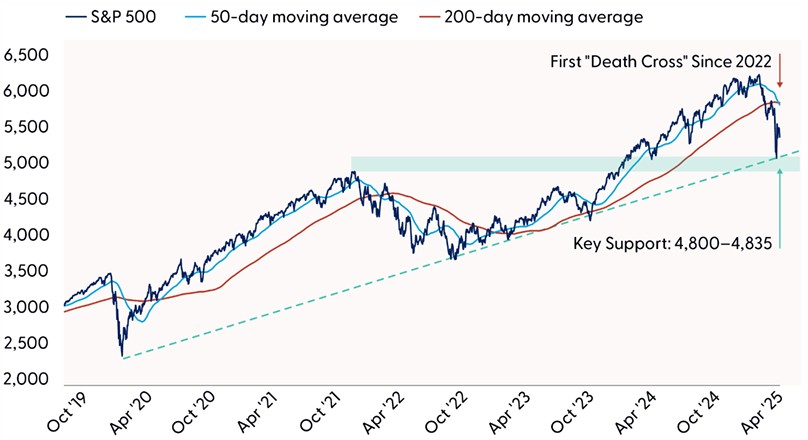
Source: LPL Research, Bloomberg 04/16/25
Disclosures: Past performance is no guarantee of future results. Indexes are unmanaged and cannot be invested in directly.
Finally, you may have read or heard about the recent “death cross” on the S&P 500 last week, defined by the 50-day moving average (dma) crossing below the 200-dma. Simplistically, death crosses indicate recent price action is losing momentum and can serve as a prescient warning sign for developing downside risk, as was the case in March ’22, early December ’18, December ’07, and Oct ’00. However, the name is not as ominous as it may sound.
Since 1950, the S&P 500 has generated respective average and median gains of 6.3% and 10.5% in the 12 months following a death cross, with 72% of the 36 occurrences posting positive results. Furthermore, when drawdowns are more severe leading into the event, returns tend to skew even more positive. For example, when the S&P 500’s maximum drawdown reached 15% or more within one month of a death cross, the average 12-month gain jumps to 16%, with 10 out of 12 periods producing positive results.
A Quick Look Underneath the Hood
Looking underneath the hood reveals a market in much need of repair. While the S&P 500 narrowly avoided a technical bear market after recording a maximum drawdown of 18.9% on a closing basis on April 8, the average constituent is trading 23% away from a 52-week high. In addition, our trend model, highlighted in the “Technical Damage Has Been Widespread” chart, shows nearly three-quarters of S&P 500 stocks are in some form of a downtrend. The technology sector has suffered severe technical damage, with 93% of sector stocks trending lower, according to the model. Given the sector’s 30% weight in the index, we continue to believe tech sector participation (at minimum) will be required for the broader market to stage a sustainable recovery.
Technical Damage Has Been Widespread
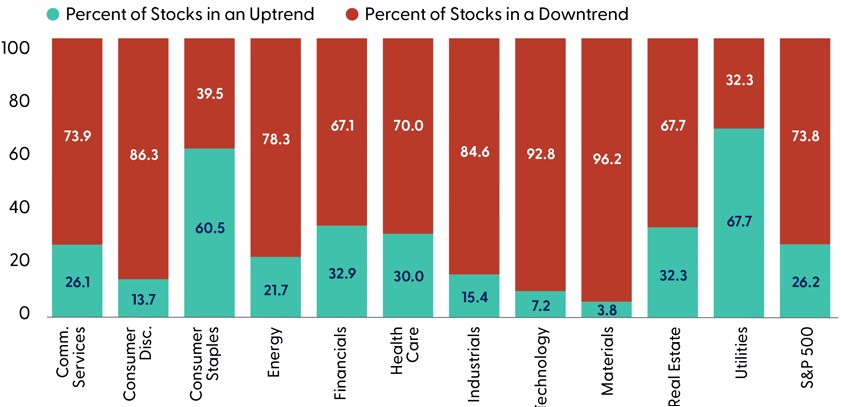
Source: LPL Research, Bloomberg 04/16/25
Disclosures: Past performance is no guarantee of future results. Indexes are unmanaged and cannot be invested in directly.
Summary
Tariff uncertainty has severely obscured visibility into corporate earnings and economic activity, as companies grapple with unpredictable cost structures, demand forecasting, and potential supply chain disruptions. The lack of clarity, combined with the likelihood of a materially higher effective U.S. tariff rate compared to 2024, could significantly impact earnings estimates. Navigating this environment remains challenging due to the binary “deal or no deal” backdrop of trade negotiations, where the absence of clear trade resolutions complicates the macro backdrop. To reflect this backdrop, we have lowered our year-end 2025 fair value S&P 500 target range to 5,650 5,800.
Asset Allocation Insights
LPL’s Strategic and Tactical Asset Allocation Committee (STAAC) maintains its tactical neutral stance on equities, with a preference for the U.S. over emerging markets, growth over value, and large caps over small. After the recent stock market rebound, the Committee does not rule out the possibility of a reversal lower and/or retest of the prior lows due to the ongoing uncertainty around tariffs and the increased risk of recession. At the same time, our updated S&P 500 price target range points to a relatively balanced risk-reward trade-off based on current market levels. We believe trade negotiations will likely soon bear fruit and offer upside potential. LPL Research continues to monitor tariff negotiations, economic data, earnings, the bond market, and various technical indicators to identify a potentially more attractive entry point to add equities.
Within fixed income, the STAAC holds a neutral weight in core bonds, with a slight preference for mortgage-backed securities (MBS) over investment-grade corporates. In our view, the risk-reward for core bond sectors (U.S. Treasury, agency MBS, investment-grade corporates) is more attractive than plus sectors. We believe adding duration isn’t attractive at current levels, and the STAAC remains neutral relative to our benchmarks.
Important Disclosures
This material is for general information only and is not intended to provide specific advice or recommendations for any individual. There is no assurance that the views or strategies discussed are suitable for all investors or will yield positive outcomes. Investing involves risks including possible loss of principal. Any economic forecasts set forth may not develop as predicted and are subject to change.
References to markets, asset classes, and sectors are generally regarding the corresponding market index. Indexes are unmanaged statistical composites and cannot be invested into directly. Index performance is not indicative of the performance of any investment and do not reflect fees, expenses, or sales charges. All performance referenced is historical and is no guarantee of future results.
Any company names noted herein are for educational purposes only and not an indication of trading intent or a solicitation of their products or services. LPL Financial doesn’t provide research on individual equities.
All information is believed to be from reliable sources; however, LPL Financial makes no representation as to its completeness or accuracy.
All investing involves risk, including possible loss of principal.
US Treasuries may be considered “safe haven” investments but do carry some degree of risk including interest rate, credit, and market risk. Bonds are subject to market and interest rate risk if sold prior to maturity. Bond values will decline as interest rates rise and bonds are subject to availability and change in price.
The Standard & Poor’s 500 Index (S&P500) is a capitalization-weighted index of 500 stocks designed to measure performance of the broad domestic economy through changes in the aggregate market value of 500 stocks representing all major industries.
The PE ratio (price-to-earnings ratio) is a measure of the price paid for a share relative to the annual net income or profit earned by the firm per share. It is a financial ratio used for valuation: a higher PE ratio means that investors are paying more for each unit of net income, so the stock is more expensive compared to one with lower PE ratio.
Earnings per share (EPS) is the portion of a company’s profit allocated to each outstanding share of common stock. EPS serves as an indicator of a company’s profitability. Earnings per share is generally considered to be the single most important variable in determining a share’s price. It is also a major component used to calculate the price-to-earnings valuation ratio.
All index data from FactSet or Bloomberg.
This research material has been prepared by LPL Financial LLC.
Not Insured by FDIC/NCUA or Any Other Government Agency | Not Bank/Credit Union Guaranteed | Not Bank/Credit Union Deposits or Obligations | May Lose Value
For public use.
Member FINRA/SIPC.
RES-0003761-0325 Tracking #727349 | #727351 (Exp. 04/26)